The day I could finally turn on tracing
Four days, 116 commits: from Datadog to a self-hosted observability stack, and why usage-based pricing decides how much of your own system you see.
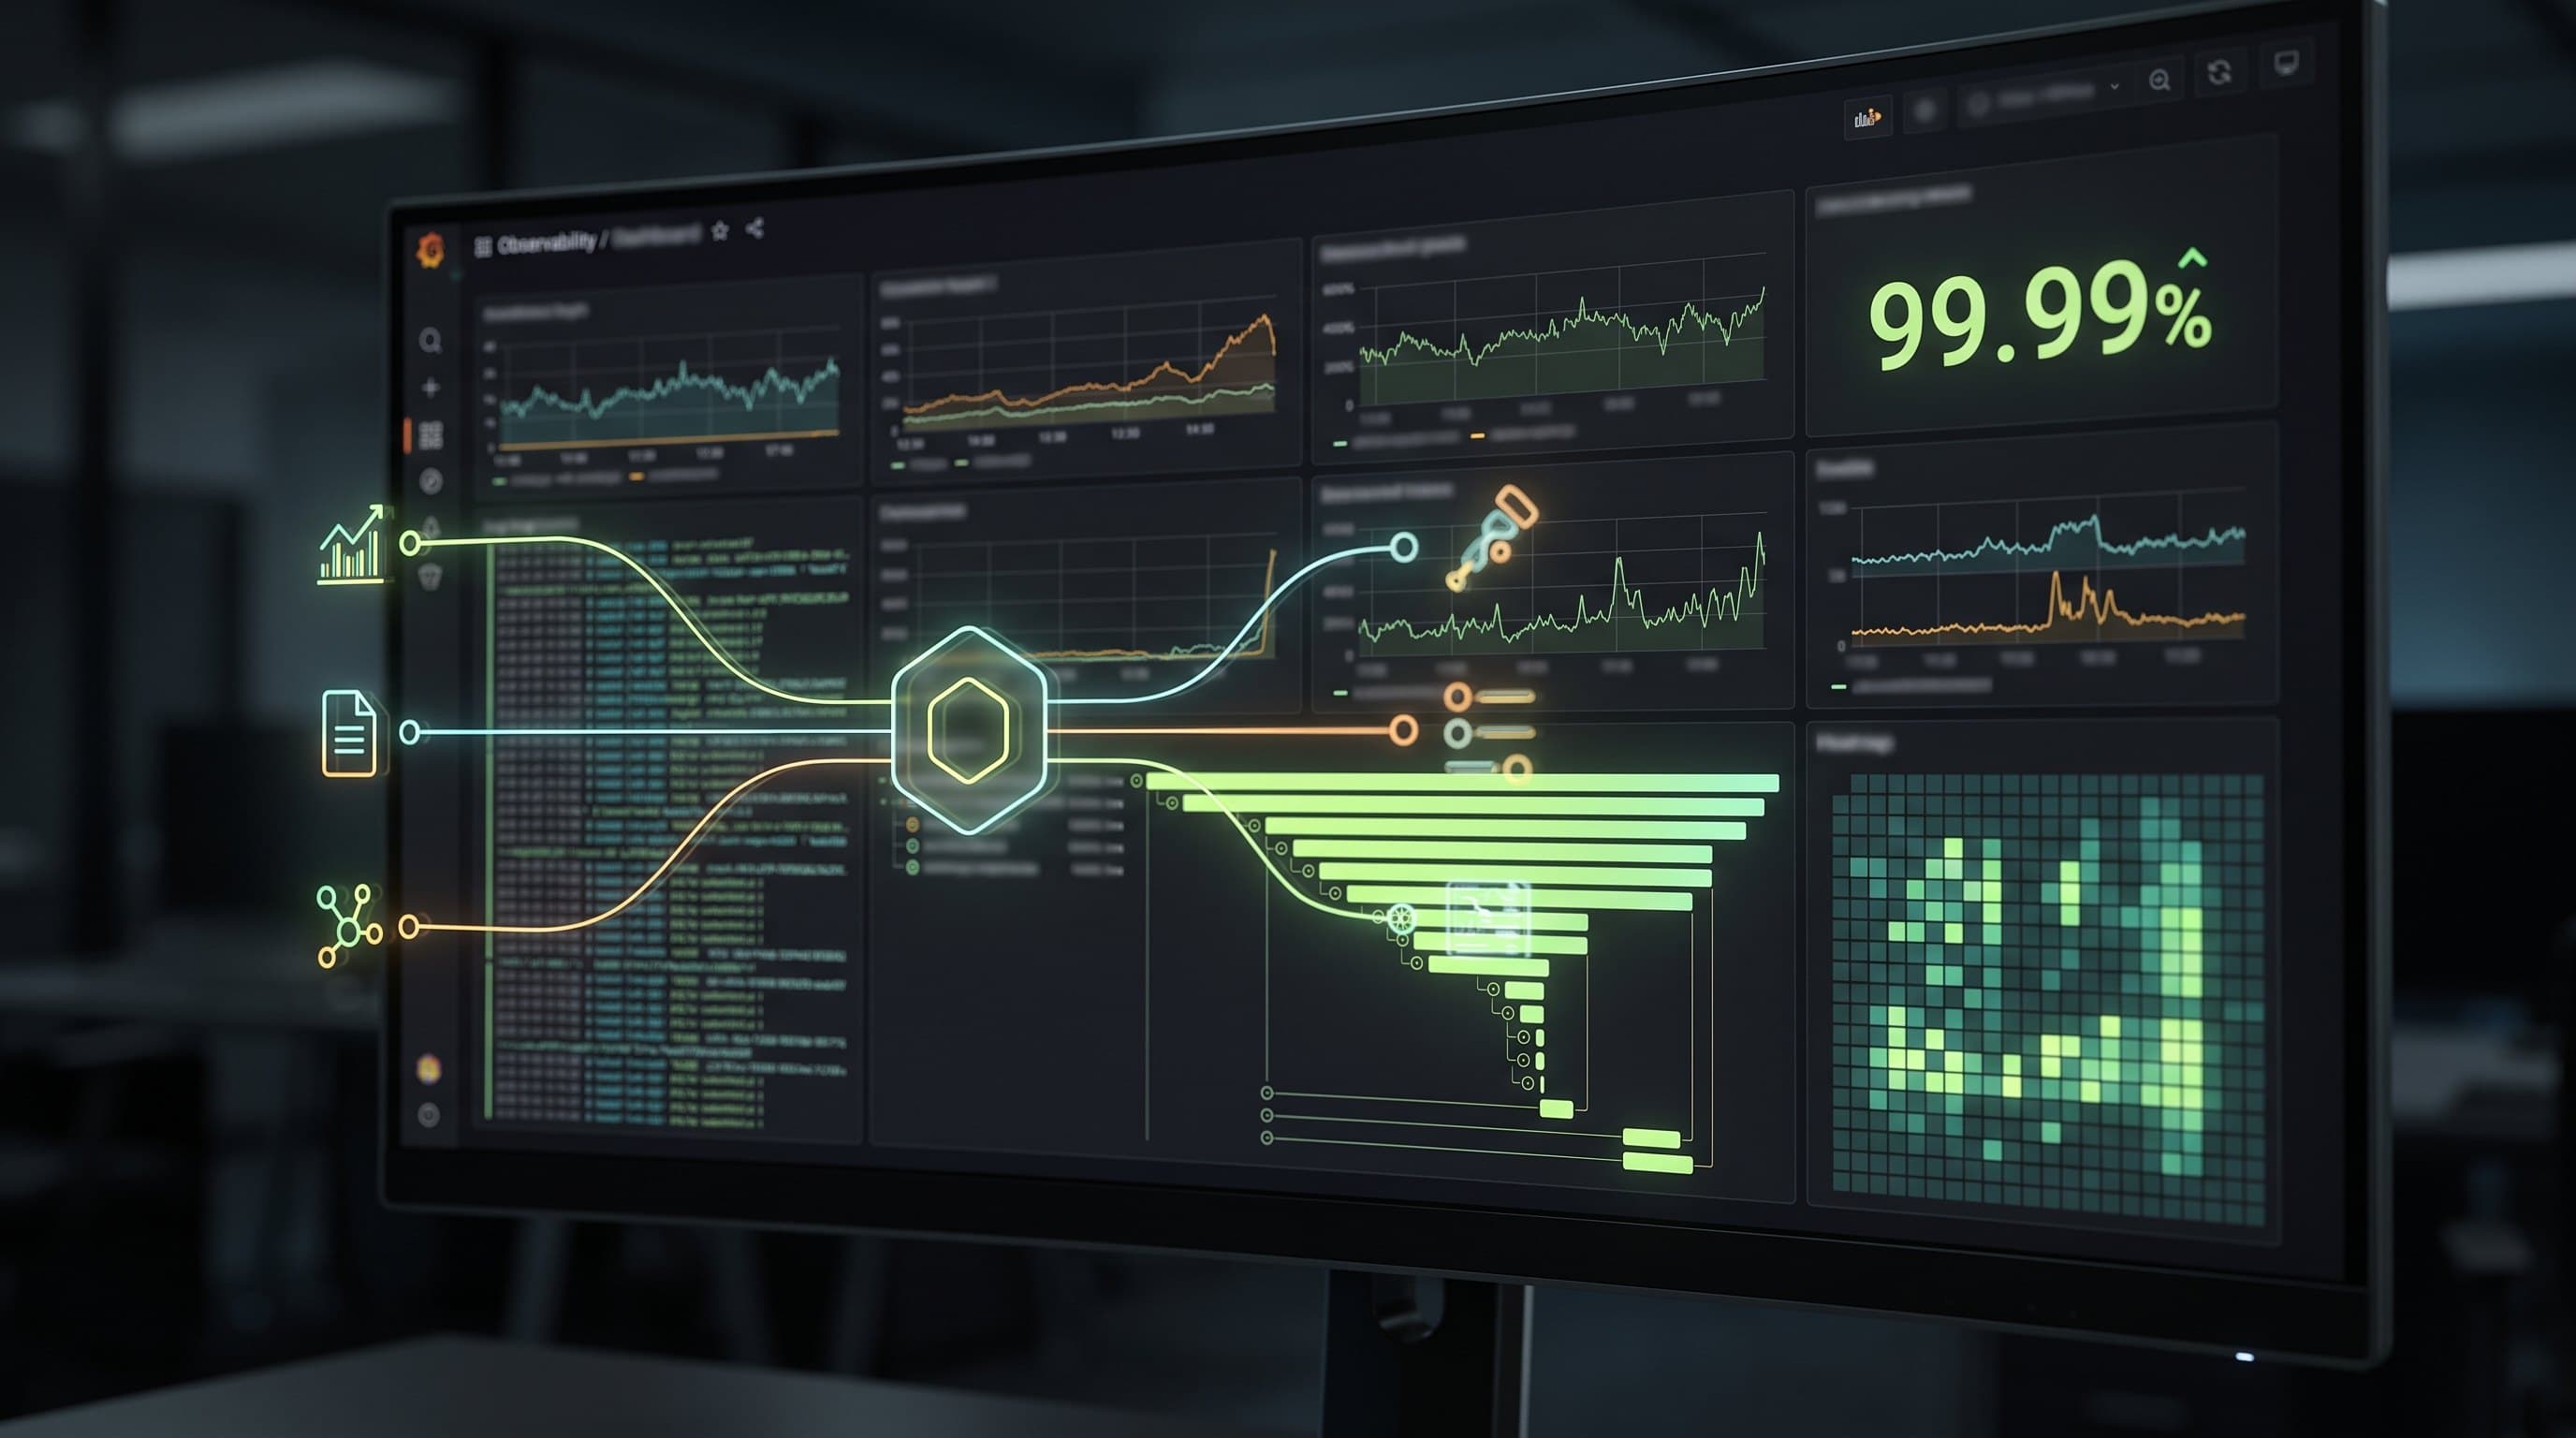
First, even if it sounds odd in a post about leaving it: Datadog is a good product. The interface is one of the best in the field, the integrations cover everything we run, and it shows you things you'd need three tools for elsewhere.
I switched it off anyway. Not because it's bad, but because we don't need most of it — and because what we would actually have needed was out of reach in that pricing model.
That is the real point of this write-up. Monitoring you can't afford is monitoring you don't turn on. And what you don't turn on, you don't see.
How the pricing model decides what you measure
This is about an application with several services: two Spring Boot APIs, two web frontends, Keycloak, Temporal, Redis, two Kubernetes clusters on Exoscale SKS. At the time of the switch: seven nodes.
Datadog's Infrastructure plan includes 100 custom metrics per host. With seven hosts, that's 700. Sounds generous — until you know how they're counted. A "custom metric" isn't one measurement, it's every unique combination of metric name and tags. HTTP response time is one measurement; broken down by method, path and status code, it's hundreds of billable time series.
I counted what Spring Boot Actuator actually exposes — today, in the running system:
count({__name__=~"jvm_.+|http_server_.+|hikaricp_.+|spring_.+|tomcat_.+|temporal_.+"})
→ 8.762
8,762 time series from the two APIs alone. Twelve times the included quota, before a single infrastructure metric is added. Every heap pool, every connection pool, every latency histogram, every HTTP status code per endpoint is a separate, separately billed custom metric in this model.
The result wasn't a cost explosion. The result was self-censorship: you simply don't collect all the JVM metrics. You drop the histograms. You don't collect logs cluster-wide; you opt in per pod. And distributed tracing — following a single request across all the services involved — costs $31 per host per month, plus volume. I never turned it on. The question "why did this request take eleven seconds" simply couldn't be answered. Not for technical reasons, but because the answer would have been a budget item.
Monitoring whose price rises with every additional observation tempts you to measure less. You notice the missing data only when something breaks.
Two reasons that aren't on the bill
Data sovereignty. We process sensitive data. The telemetry was stored on Datadog's EU site; that was never the issue. The processor was still a US company, with everything that legally comes with it. Our record of technical and organisational measures listed Datadog Inc. as a sub-processor. That entry is gone now. Logs, metrics and traces live in Austria, in buckets that two named IAM roles can access.
None of it was code. Dashboards and monitors were clicked together in the web UI. There was no review, no diff, no rollback and no answer to the question "who changed this threshold from 5 to 50, when, and why". For a team that keeps every line of infrastructure in Pulumi and ArgoCD, that was the last blind spot.
What takes its place
Before we start, the names — they all come up again below. Six building blocks together replace what a single vendor delivered before. The combination is known as LGTM: Loki, Grafana, Tempo, Mimir. Here VictoriaMetrics takes Mimir's place; more on why below.
| Building block | Job | Datadog equivalent |
|---|---|---|
| Alloy | collects telemetry and ships it — the "agent" | Datadog Agent |
| VictoriaMetrics | stores metrics: measurements over time | Datadog Metrics |
| Loki | stores logs | Datadog Logs |
| Tempo | stores traces: the path of a request through every service | Datadog APM |
| Grafana | shows everything and raises alerts | Datadog UI + monitors |
| Faro | measures what happens in the users' browsers | Datadog RUM |
All of it is open source and runs on the Kubernetes infrastructure that's already there.
Monday: the inventory
The self-hosted stack started from a clean slate. Before building anything, I wrote down everything Datadog was doing at that point: every place in the repository, with file and line number, 20 in total.
The result:
- Datadog ran in both clusters, with OTLP receiver, trace agent, process agent and kube-state-metrics.
- RUM, measurement in the users' browsers, ran in both frontends, for every session.
- CI uploaded the source maps to Datadog on every build.
The new stack has to take all of that over without a gap. So the old and the new stack run in parallel for a while, and that shapes the whole rebuild:
Anything additive is allowed, nothing is taken away from Datadog. After every milestone, production has to work. The price for that is a fourth prod node at €68 a month.
Along the way something turned up that had nothing to do with monitoring: both applications' source maps were publicly accessible; requests for .map returned HTTP 200 in production. For the rebuild that was handy: Alloy fetches them itself, so the source map pipeline in CI could be dropped without replacement.
Then the choice of tools. The plan was Mimir, Grafana's metrics database. But there is no Helm chart for running it as a single instance, so it became victoria-metrics-single.
Tuesday: the foundation
VictoriaMetrics, Loki, Tempo, Alloy, a dedicated Kubernetes namespace, two object storage buckets, each with its own permission scoped to that bucket alone. Plus data sources, the first Kubernetes dashboards and — not as an afterthought — the same stack in the local development environment, so I can test an alert rule locally instead of discovering it in production.
I rolled out Tempo right away, even though no traces were arriving yet. That way setup errors show up while nothing depends on it yet, not on the day the traces are switched over.
The pitfalls came right away and were all of the same kind — configuration that looks plausible and doesn't do what it says:
- A
retentionDiskSpaceUsageflag that doesn't exist in that spelling. - A Grafana admin password that the chart re-rolls on every render, so it drifts from what's in Grafana's database — which silently breaks provisioning reloads.
- And the classic:
*.svc.cluster.local. Exoscale SKS doesn't use it. There the cluster domain is<cluster-uuid>.cluster.local. Every fully qualified name from a Helm default resolved to nothing.
The same mistake was behind the Loki caches that turned up on Thursday.
Wednesday: one gateway for metrics, logs and traces
58 commits in one day. It was the day data first flowed into the new stack.
The central decision of the rebuild sits in a single component: a publicly reachable Alloy at ingest.example.at that speaks OTLP natively. OTLP is the protocol of OpenTelemetry, the vendor-neutral standard for telemetry: one format for all three signals that every tool understands by now. Everything that comes from outside arrives here. Outside means: the external service, the users' browsers and, as it turns out, the test cluster too.
I had started with the obvious: a Prometheus remote-write receiver, a Loki push receiver, each on its own path, authentication via a Traefik middleware. It worked, but it had a design flaw: every sender needed its own path per signal, and the sender's identity never made it into the processing pipeline. I replaced it the same day with one OTLP endpoint:
| Path | Signal |
|---|---|
/v1/metrics | Metrics |
/v1/logs | Logs |
/v1/traces | Traces |
/collect | Browser telemetry (Faro) |
The real gain isn't the tidy paths, it's where authentication happens. It moved from Traefik into Alloy, because otelcol.receiver.otlp can pass the authenticated identity down the processing chain. A processor stamps a client attribute from it:
otelcol.processor.attributes "identify" {
  action {
    key          = "client"
    from_context = "auth.username"
    action       = "upsert"
  }
  ...
}
So a sender can't impersonate another. And a new sender is now one name in Pulumi — it becomes the basic auth username, the htpasswd line and the value of the client attribute on everything it sends. Before, the same thing needed a URL path, an ingress, a middleware, a service port and a receiver per client. Neither a Loki nor a Prometheus receiver in Alloy can read request headers; OTLP can.
Revoking works the same way backwards: remove the name from the list, pulumi up. Whatever the client has already sent still carries its label, so it can be found — and deleted:
{client="extern-standort-a"}This kind of client is exactly why the effort was worth it. One of our services does not run with us but as a standalone installation at an external site. It used to push directly with a Loki-specific library; now it speaks the same protocol as everything else via the OpenTelemetry Logback appender and will carry traces too, without a second transport. Without a password, telemetry isn't set up at all — an installation that hasn't received credentials yet stays quiet instead of looping forever. At startup the installation reports whether telemetry is running or switched off for lack of credentials. The old setup didn't report that.
A subtlety I had underestimated: incoming OTLP is translated back into the backends' native formats at the gateway instead of being forwarded to their own OTLP endpoints. Forwarding would look cleaner but costs real compatibility — Loki's OTLP ingestion only indexes its fixed attribute list, renames namespace to k8s_namespace_name and pod to k8s_pod_name, and drops cluster entirely. Exactly the labels every dashboard and every alert filters on.
Browser telemetry arrives via /collect, with its own ingress. The shared ingress for all other senders requires credentials, and a browser can't send any without exposing them to every visitor. Faro replaces Datadog RUM here: errors, console output, Web Vitals, user interactions, browser-side traces. Security rests on three settings, two of which are insecure by default: download_from_origins is pinned to our domains, because Alloy fetches source maps from whatever origin the payload names — the default ["*"] turns a crafted exception into an SSRF tool. No field sent by the browser may become a Loki label; otherwise a session ID blows through the stream budget and Loki starts rejecting the clusters' logs. And a rate limit on the ingress is the only thing between the open internet and Loki's ingest budget.
The gateway itself is guarded by a blackbox probe that defines 401 as the healthy state. That checks two things at once: the endpoint is alive, and authentication is still in front of it. A 200 here would mean: publicly writable.
Wednesday, part two: the test cluster stores nothing
Which brings me to the part I'm proudest of, because it costs nothing.
A second cluster tempts you to build the stack twice. Two VictoriaMetrics, two Lokis, two Tempos, two Grafanas — and then two separate data sets you can't compare in one dashboard. Instead, I set up the backends in production only. The test cluster runs Alloy. Nothing else:
const services = [
  { service: 'alloy' },
  ...(zone === 'prod' ? [
    { service: 'victoria-metrics' }, { service: 'loki' }, { service: 'tempo' },
    { service: 'alloy-external' }, { service: 'blackbox-exporter' }, { service: 'alloy-gateway' },
  ] : []),
];
That makes the test cluster simply another ingest client — the same endpoint, the same procedure, the same client attribute as the external service. It authenticates with its own credentials and sends all three signals through one destination instead of configuring a protocol per signal:
destinations:
  gateway:
    type: otlp
    url: https://ingest.example.at
    protocol: http
    metrics: { enabled: true }
    logs:    { enabled: true }
    traces:  { enabled: true }
That's the practical advantage of native OTel you only feel in operations: one transport, one credential, one address — for metrics, logs and traces at once. When traces were added later, not a single line had to change here.
The result: one Grafana shows both clusters. Every dashboard filters by a cluster variable, every alert can cover both environments in one rule, and an error that shows up in test sits next to the same graph from production instead of in a second browser tab. In return, the test cluster carries no storage, no retention, no backup and no operational load — and it can be rebuilt at any time without losing history.
It wasn't entirely free. Logs arriving via OTLP initially came with client, exporter, job and service_name — and nothing else. Everything production writes natively also carries cluster, namespace, pod and container. So there was no way to filter the test logs precisely. The attributes were there, just not promoted: otelcol.exporter.loki only turns an attribute into a label when a hint names it. On top of that, the collectors send k8s.namespace.name, not namespace — which would have produced k8s_namespace_name, so different label names in test than in production. A transformation copies the k8s.* names onto the short ones first. The promotion hint, by the way, is set at the gateway, not by the sender: otherwise a client could declare any high-cardinality attribute a label.
Wednesday, part three: the agent goes
The Datadog agent cost 650m CPU and 1.45 GiB of declared requests — 2.06 GiB in reality — on nodes that were already showing a memory warning. With the gateway, Faro and the collectors, everything it did was covered. So it went.
In between, the most instructive bug of the day. In the test cluster, an alert "pod restarting repeatedly" fired for pods that demonstrably hadn't restarted. The cause was a chain of small things:
- kube-state-metrics attaches a label
service_nameto some thirty data points: the name of the Kubernetes service behind an ingress path. - OpenTelemetry has an almost identically named field,
service.name, which identifies the sending application. On the way via OTLP, the Helm chart treats everyservice_nameas that field and sets it for the whole scrape, i.e. for all metrics collected together. - So all 8,400
kube_*series got the service name of one of those thirty data points. Which one depended on the processing order and changed with every scrape. - For the metrics database, a different label value is a different time series. Every restart counter thus broke up into several time series that kept disappearing and reappearing.
- The alert uses
increase(), i.e. how much a counter has gone up.increase()reads a reappearing time series as a counter starting again from zero. A restart counter sitting unchanged at 7 thus looked like seven new restarts.
The same day, the allowlists the chart uses to drop metrics were removed too. Measured: about 29,000 series per cluster were being thrown away. Among them container_fs_usage_bytes, the PSI pressure metrics, kube_persistentvolume_*, container_memory_rss — exactly what you reach for first in an incident. Keeping everything costs about 26% more series on a volume that's 0.2% full.
That's the moment the new cost model becomes tangible. With Datadog, this decision would have been a pricing question. Here it was a question of whether there was enough disk space.
Thursday: cleaning up, and what turned up
The stack was running. What came next was cleaning up — and that brought to light what had been running invisibly for years.
Both APIs had an open JMX port: authenticate=false, ssl=false, local.only=false on 9999. Set up for a Datadog JMX check that hadn't existed since the day before. No service exposed it, it was only reachable inside the cluster. From there, though, anyone could call arbitrary JVM functions.
Twelve collector pods ran without any resource request; the only request on each pod came from the sidecar: 50 MiB, compared with 200–300 MiB of actual usage. The scheduler underestimated the namespace by about a gigabyte, and because the kubelet evicts by "usage above request", the collectors, of all things, were first in line under memory pressure. Lose them, and you lose sight of what's happening right now.
Our WebSocket service had a real defect: neither of its two Redis clients had an error listener, so the client wrote directly to stderr in plain text, bypassing the logger. The service hadn't logged anything above info in thirty days, while Redis outages went unrecorded.
And Loki had two caches that were never used: deployed as Memcached pods, reported healthy, 805 MB reserved — and never a single request, because their address was built from the Helm default with cluster.local. 263 GB of egress in a single day, because every chunk came over the network individually. From the outside everything looked healthy. It only showed up in the network traffic.
What's different now
| Telemetry | Datadog, as we had it | Self-hosted, today |
|---|---|---|
| Infrastructure metrics | yes | yes, without allowlist — +29,000 series per cluster |
| Spring/JVM metrics | a fraction, limited by the custom metric budget | complete, 8,762 series |
| Distributed tracing | never turned on — not affordable | Tempo, 30 days |
| Logs | opt-in per pod | all namespaces, both clusters, 90 days |
| RUM | Datadog RUM, session replay off | Faro: errors, Web Vitals, interactions, browser traces |
| External installations | an agent per site | one OTLP endpoint, one name in the IaC |
| Test cluster | full agent, its own view | collector only, writes to production |
| Keycloak | no metrics | 1,507 series the image exposed anyway |
| Managed Postgres | — | full DBaaS dashboard, 9 alerts |
| Dashboards & alerts | clicked together in the web UI | 31 dashboards, 353 panels, 67 rules — in Git |
| Dead man's switch | — | external heartbeat every 10 minutes |
| Data processor | Datadog Inc. | none |
| Data residency | EU site of a US vendor | Austria, our own buckets |
The costs
| Item | € / month |
|---|---|
4th prod worker (standard.large) | ~68 |
| Block storage, metrics volume | ~6 |
| Object storage, logs + traces | ~1–2 |
| External uptime check, heartbeat | 0 (free tier) |
| Total | ~75 |
An honest comparison is difficult, for a revealing reason: the old bill was lower than the feature set would suggest — because the feature set was dictated by the bill. No APM, logs opt-in only, metrics only a selection.
If instead you calculate what today's scope would have cost at list prices, the order of magnitude becomes clear. Indexing alone: 13.9 million log lines per day are about 417 million events a month, at $1.70 per million (15-day retention, annual contract) that's over $700 a month, just for log indexing. APM for seven hosts would add $217, and the custom metric quota would be exceeded twelve times over.
For €75 a month in infrastructure: 200,012 active time series, 90 days of metrics, 90 days of logs, 30 days of traces, RUM without sampling, two clusters, one external site.
What I lost
Leaving this out would be dishonest.
The interface is worse. Datadog's UI is better than Grafana, and anyone who worked with it every day notices that on every other click. Session replay is gone. Watchdog and automatic anomaly detection are gone. The whole security monitoring area, which we never used, is gone — that doesn't really count, but to be fair, it would be there if we needed it.
And the stack now runs in the prod cluster, the same place as the workloads it monitors. If the cluster goes down, I'm blind. Two external checks still tell me that something is broken; the history for the post-mortem is lost. That's a deliberate decision for a small team, not an oversight — and it's written down, along with the condition under which I'll revisit it.
What remains
Four days, 116 commits, 162 files, just over 42,000 lines. No maintenance window, no outage, no data loss. The result is a monitoring namespace in which every line of configuration is reviewable, diffable and revertible.
But the lesson isn't "self-hosting is cheaper". Sometimes it is, often it isn't, and the €75 in the table doesn't include a single hour of work.
The lesson is: a usage-based pricing model is an architectural decision. It determines how much you're allowed to see, and it does so quietly, spread across hundreds of small non-decisions — not this histogram, not that namespace, tracing next year. You don't notice it on the bill. You notice it at three in the morning, when the data you'd need right now is missing.
In these four days I learned more about our own system than in any comparable period before. Not because the new tool is better than the old one — it isn't — but because I was finally allowed to turn it on everywhere.
Got a similar project in mind?
In a free initial call we look at your situation and tell you what's realistic and what the next step looks like.

// about the author
Alexander J. Gassner, MSc
Founder and managing director of agsolutions, with more than 15 years in software development (MSc Software Engineering, FH Hagenberg). Builds and runs business-critical software from requirements to operations: Kotlin, Spring Boot and React in the code, Kubernetes, Pulumi and GitOps in operations, as an Exoscale Certified Solution Architect.